Know who’s
using
Claude
— and how
well.
Mojule gives engineering leaders real-time adoption & ROI intelligence across Claude Code and Claude Cowork — turned on by your Anthropic org admin, zero install. One dashboard. Every team.
Built on enterprise-grade infrastructure
Enterprise visibility, zero friction
Everything you need to understand Claude adoption across your organization.
Up and running in minutes
Three steps from sign-up to your first adoption report — no endpoint install.
Sign up
Create your org in 30 seconds via WorkOS SSO. We hand you a collector URL and a bearer token.
Turn on OTEL
Your Anthropic org admin pastes the collector URL and token into the Anthropic console — Cowork Monitoring and Claude Code managed settings. Nothing installs on endpoints.
See your data
Real-time adoption & ROI dashboard with KPIs, charts, team breakdowns, and exportable reports.

Set once by your org admin. Applies fleet-wide. Nothing installs on endpoints.
Your adoption command center
KPIs, weekly active users by team, per-user breakdowns, and threshold alerts — all in one place.
The Mojule dashboard with sample data — active users, session counts, surface breakdown, and per-user adoption table.
See your team's Claude adoption in real-time
Get started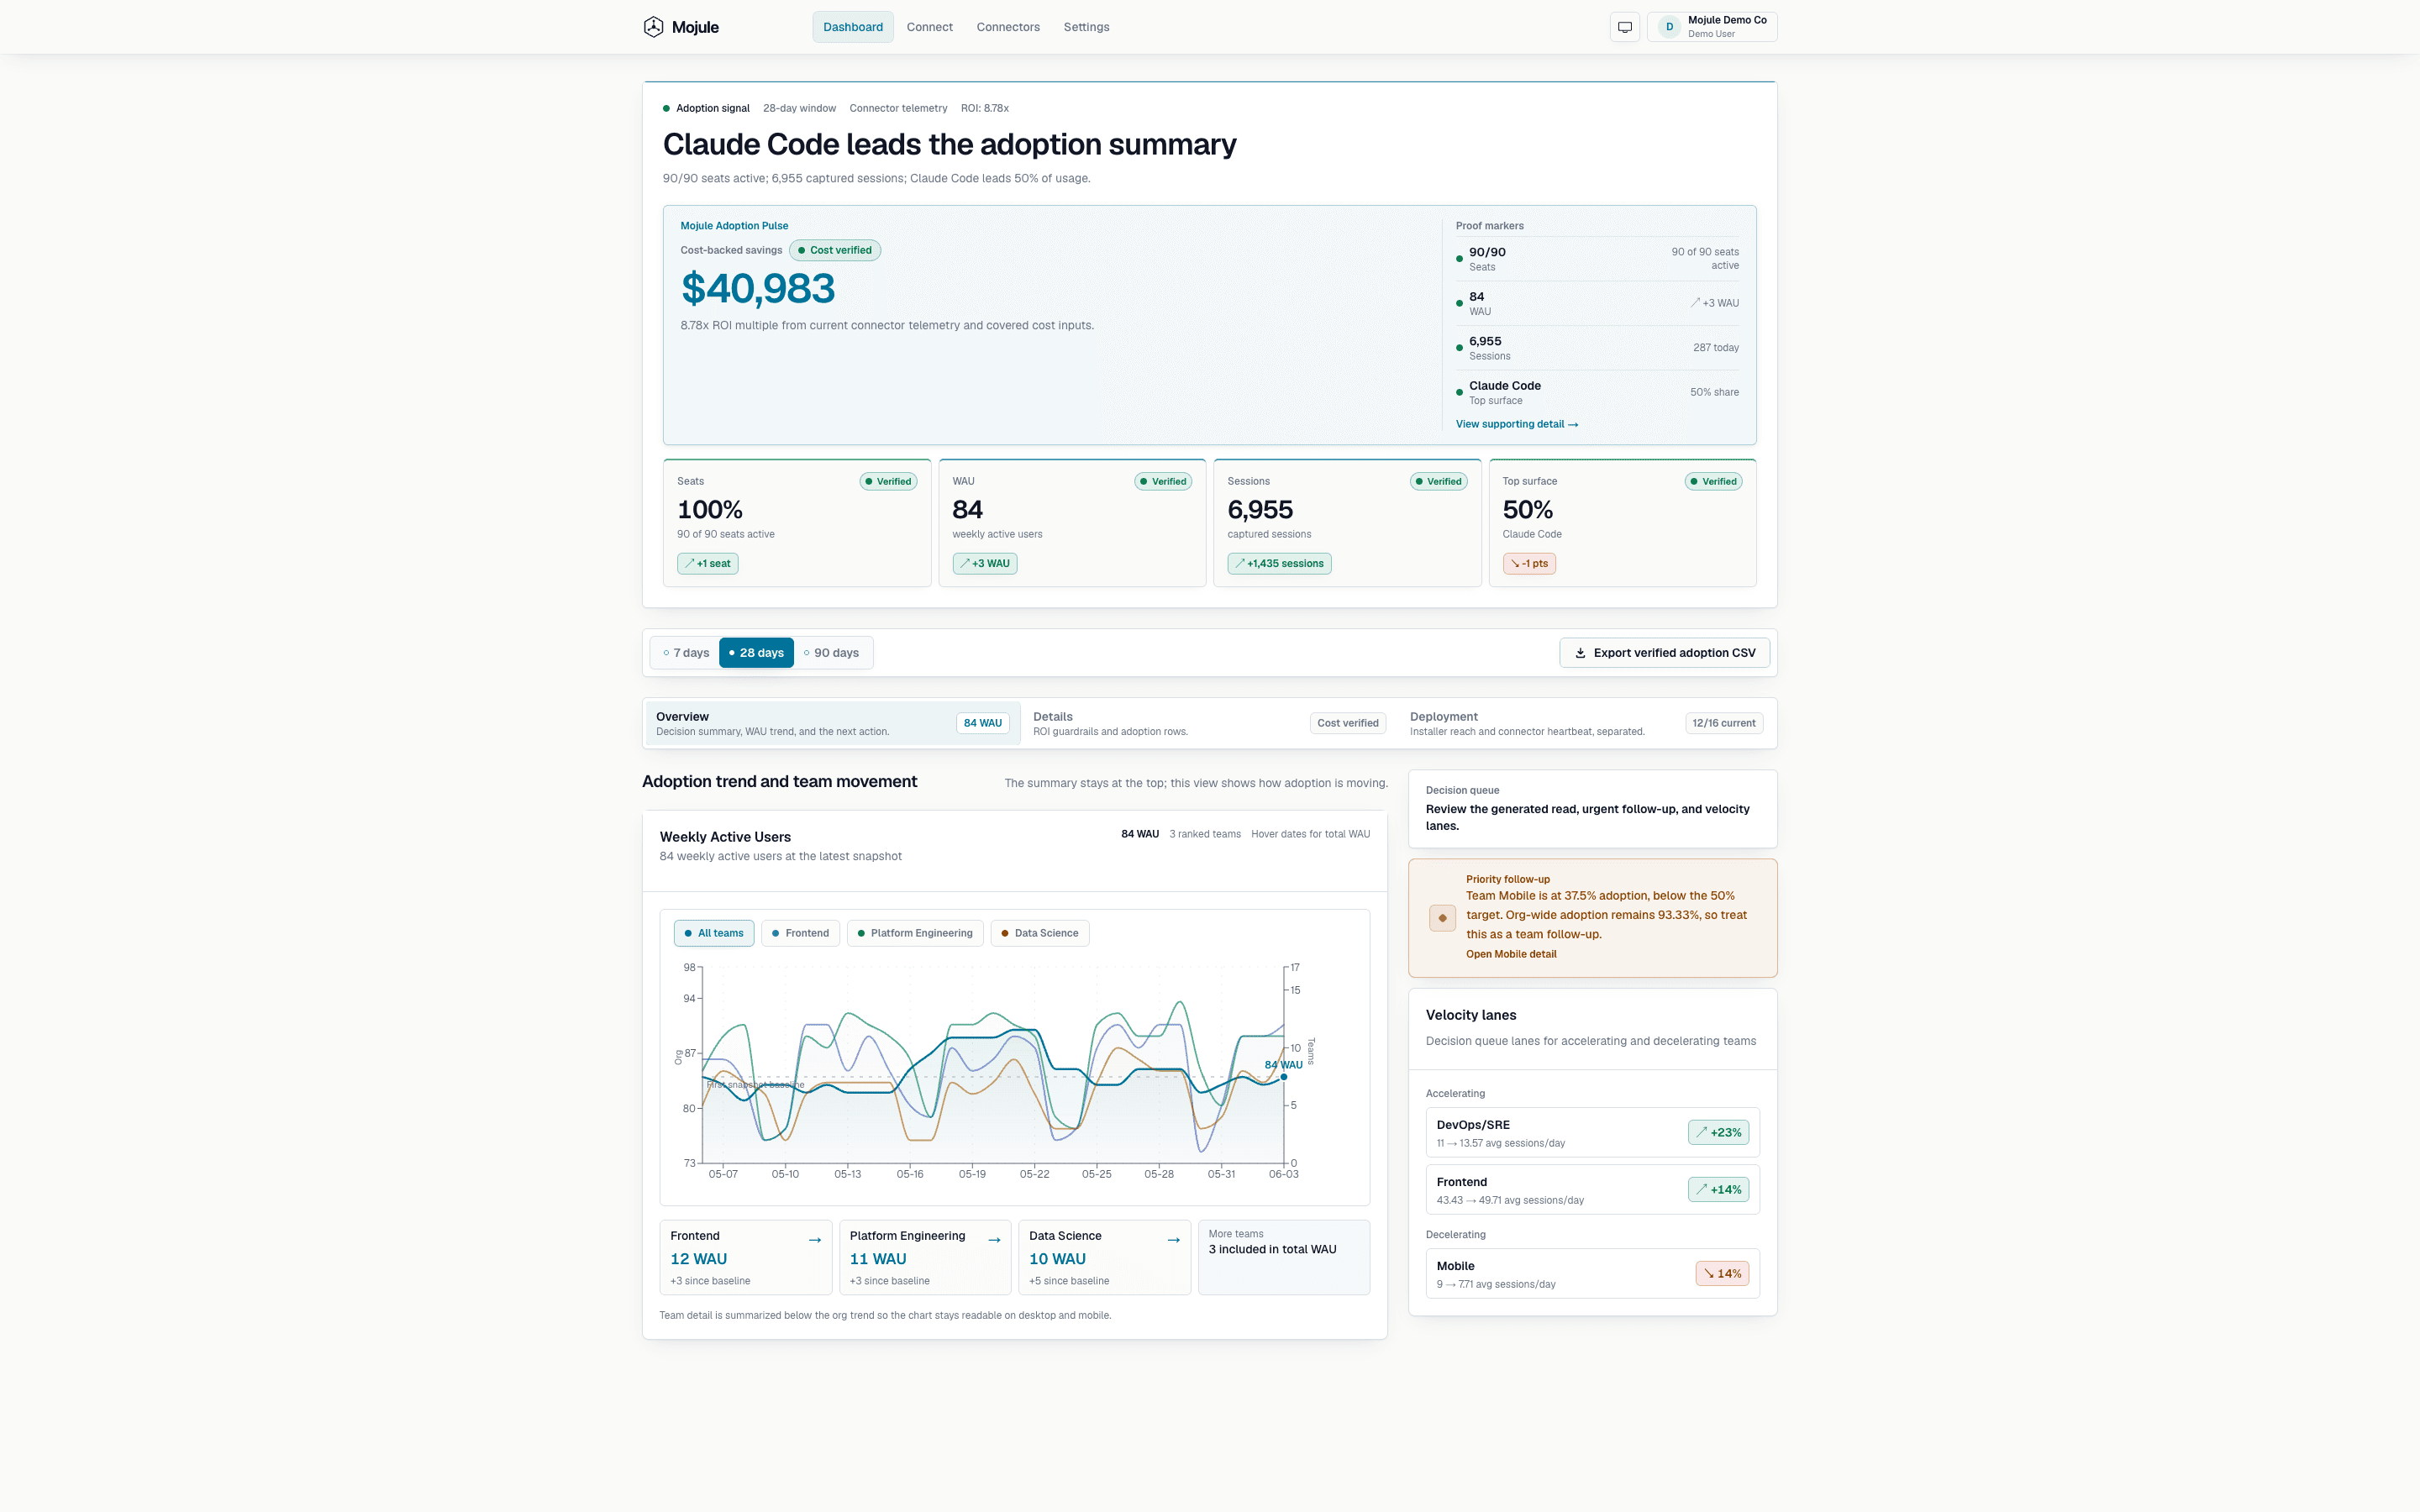
Adoption overview
Executive metrics, adoption pulse, and stable charts.
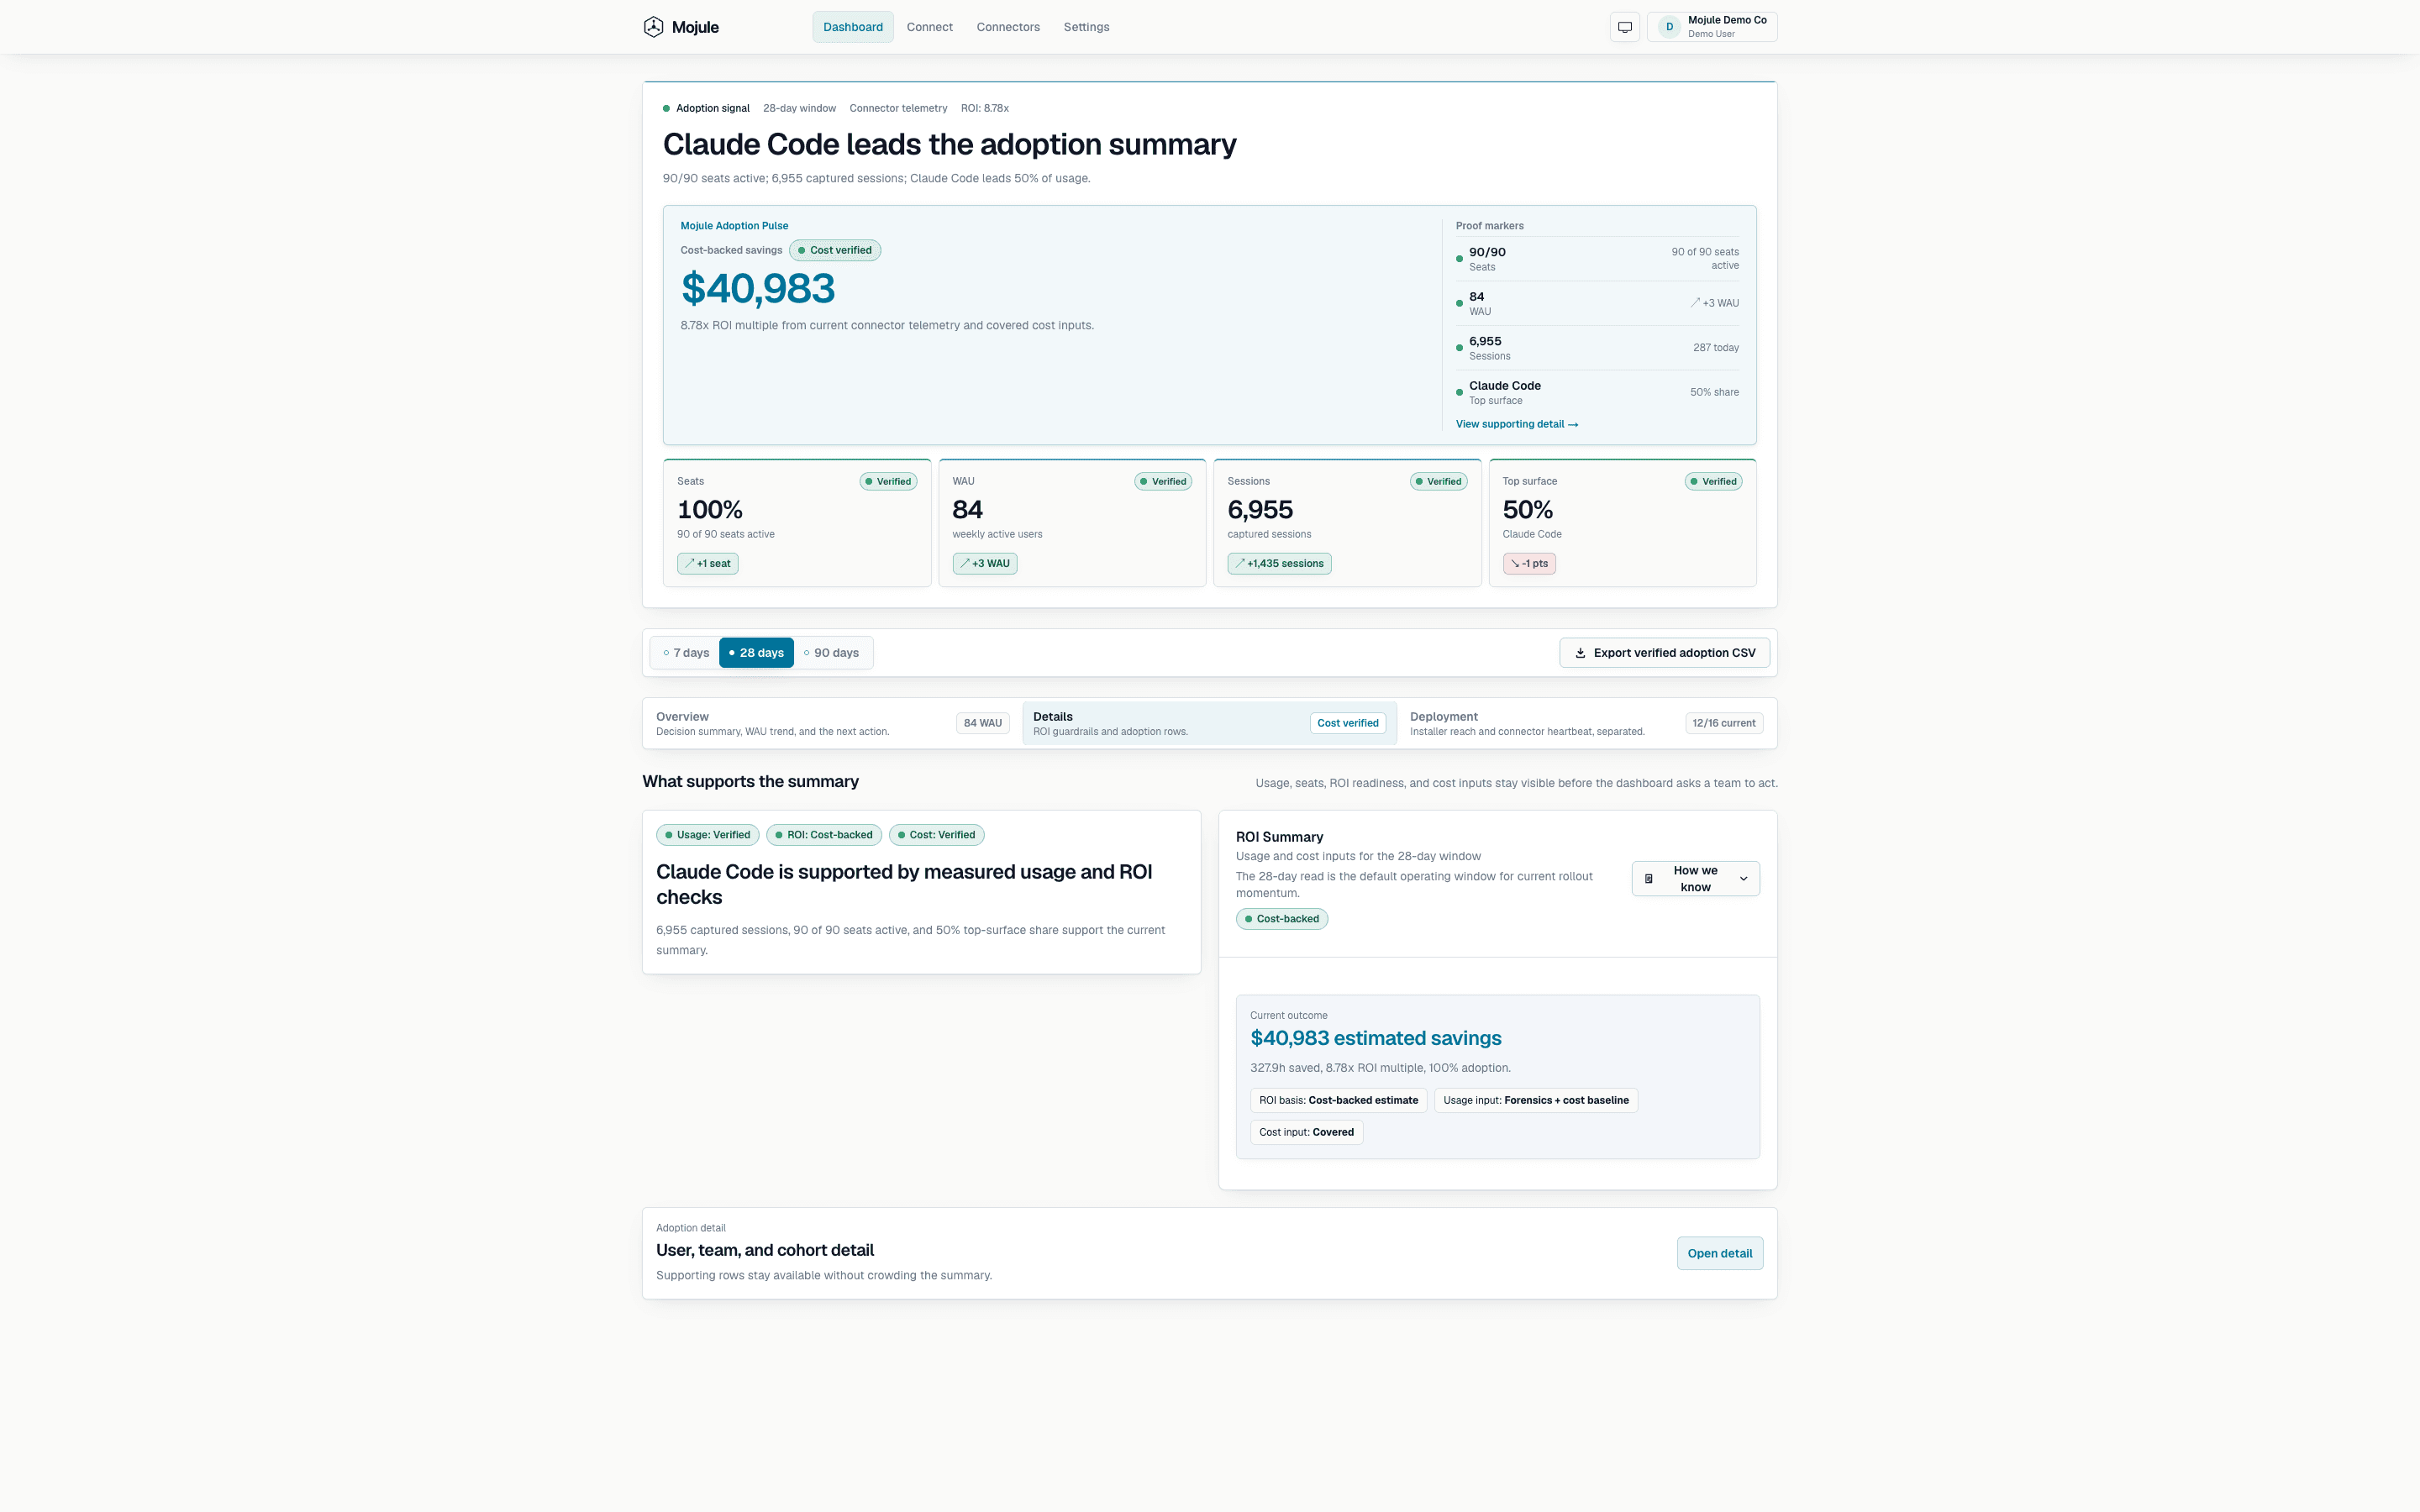
Evidence board
Evidence-backed usage mix and reporting details.
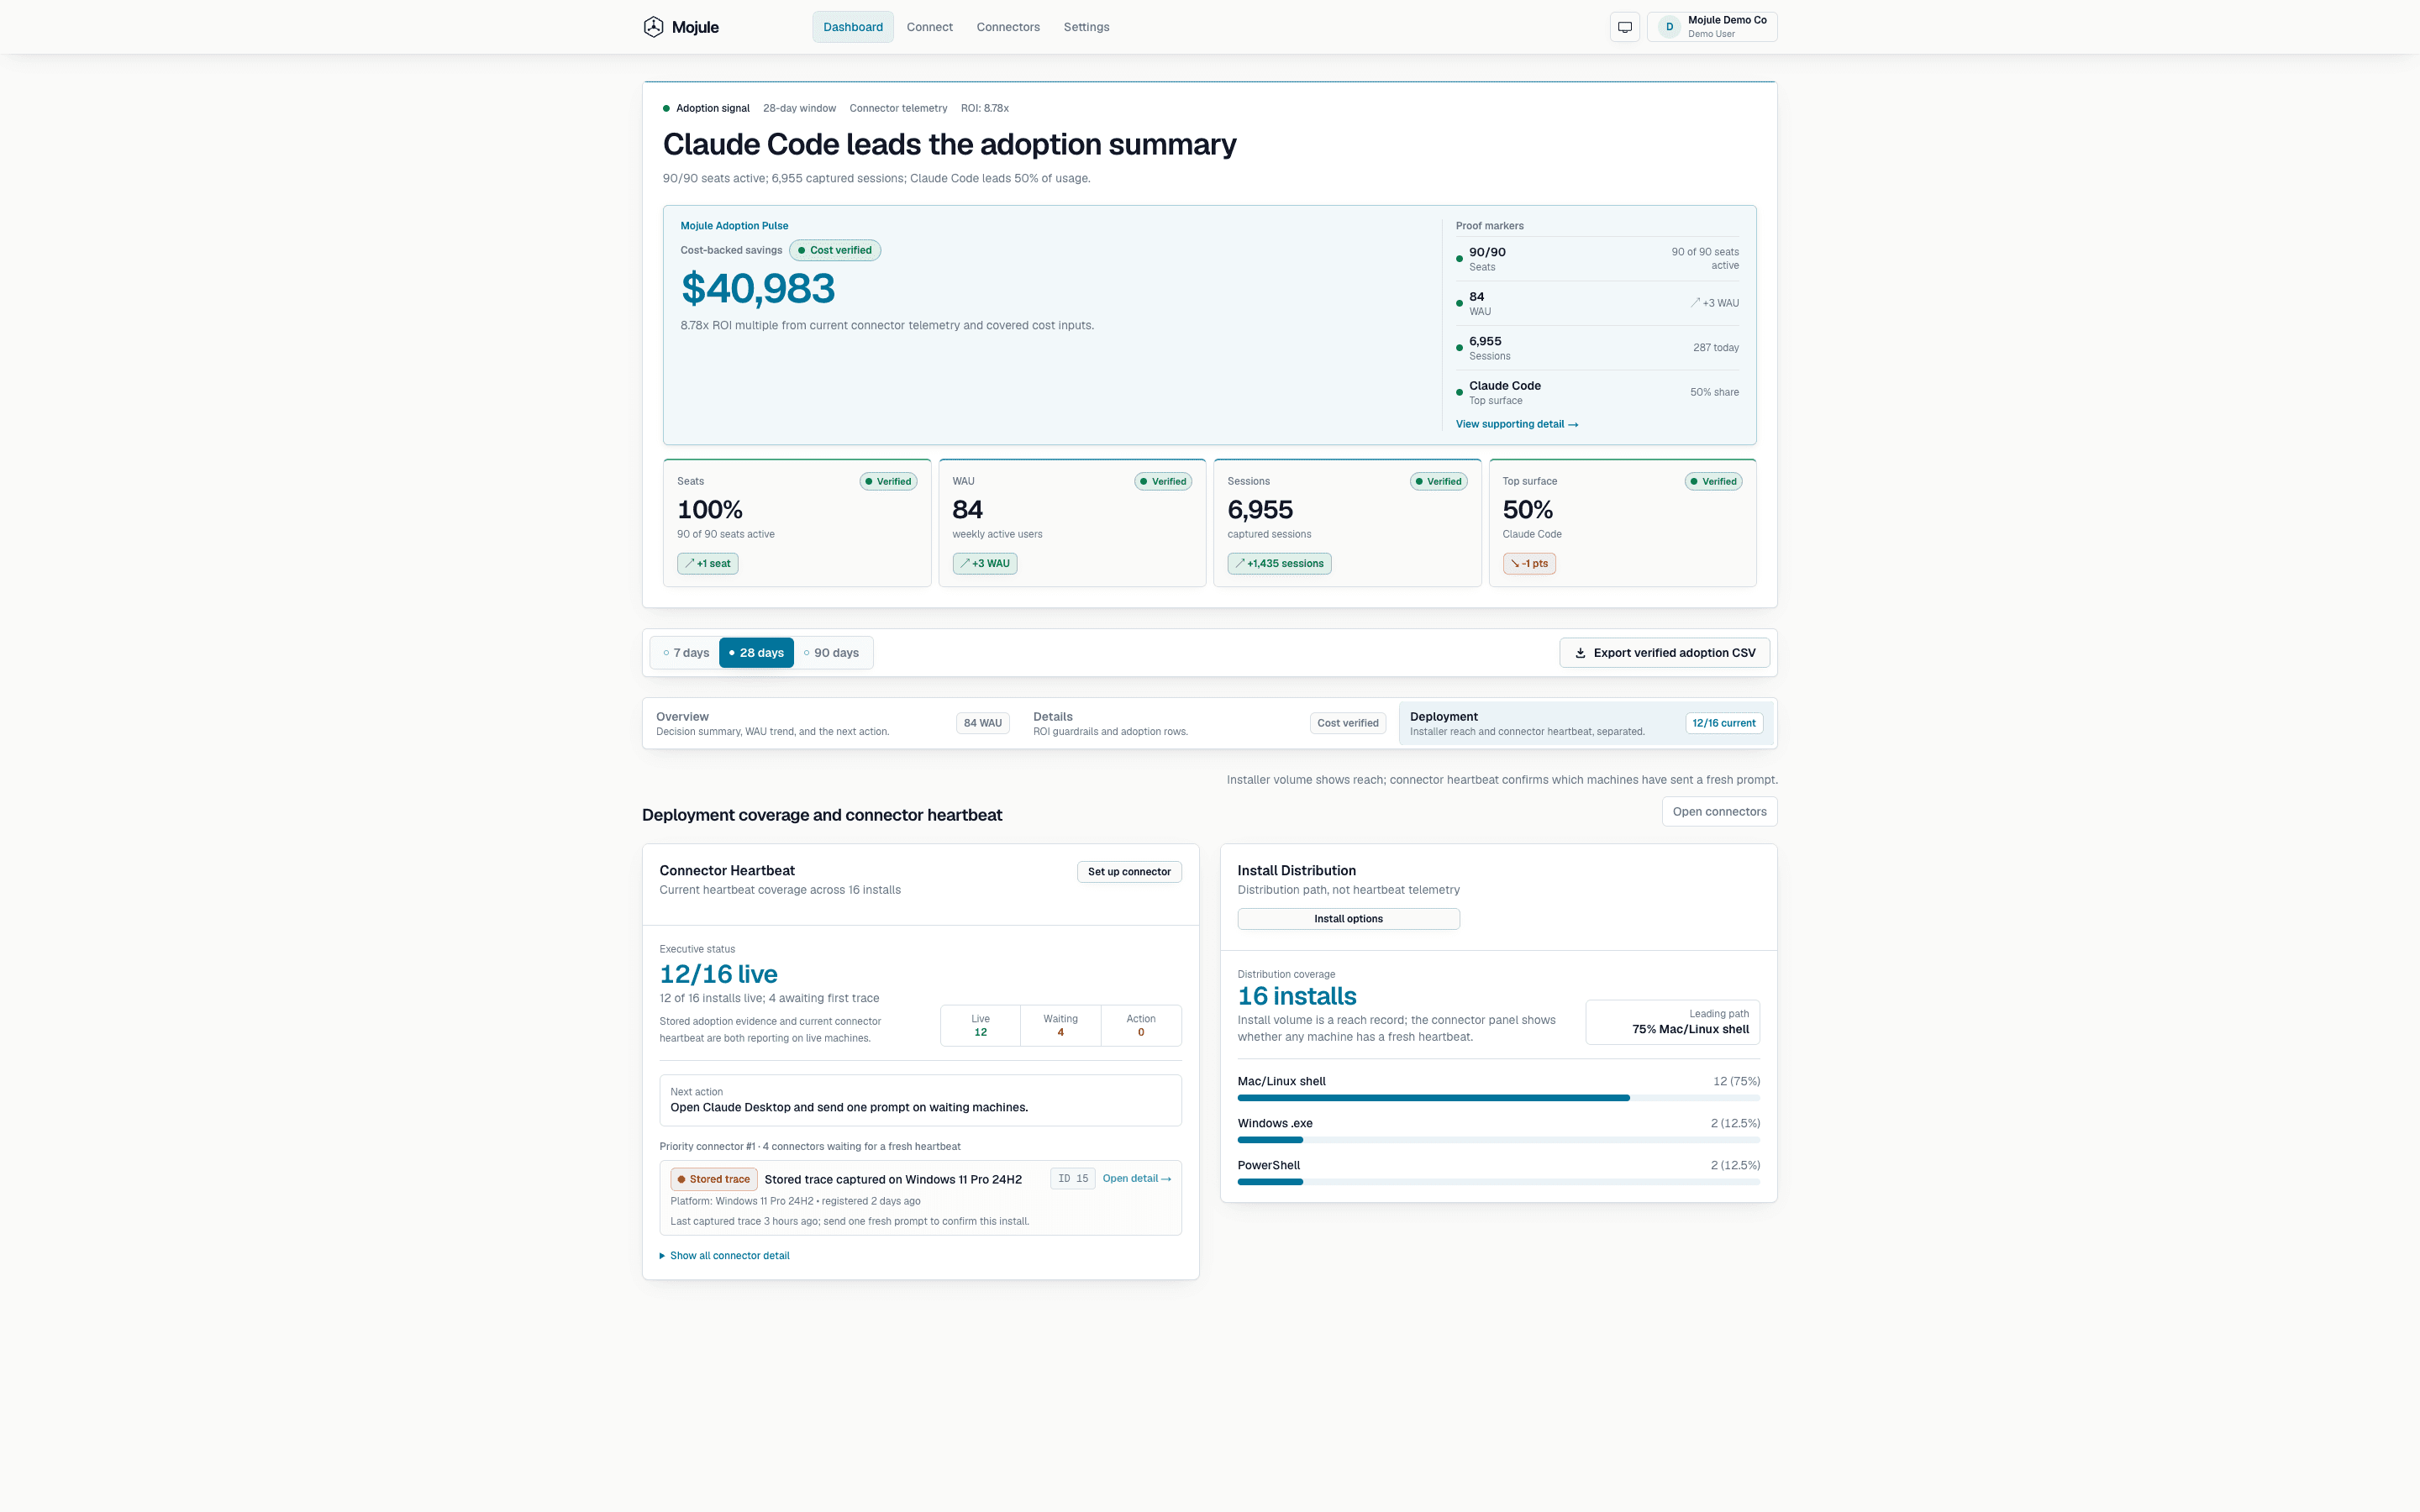
Deployment health
Connector heartbeat, install coverage, and rollout status.
Simple, transparent pricing
Start free. Scale as your Claude adoption grows.
- Everything in Free
- 90-day data retention
- CSV exports
- Email support
- Everything in Growth
- 1-year data retention
- Team-level breakdowns
- Priority support
- Everything in Scale
- SSO + SCIM provisioning
- Dedicated onboarding
- SLA guarantee